Looking back since I started it in January 2020 when I moved away from Medium.
Not much lately
The last post was from May. So yes, I don’t write here regularly. But the last months have been really busy, I’ve changed job and I don’t only write here. I’m one of the 3 service designers behind the Practitioner Stories and did a lot of writing for this.
I also don’t always have something worth sharing. And that’s the point of this blog: Sharing if I feel I have something that can be useful to others.
Tube Map – Make your own
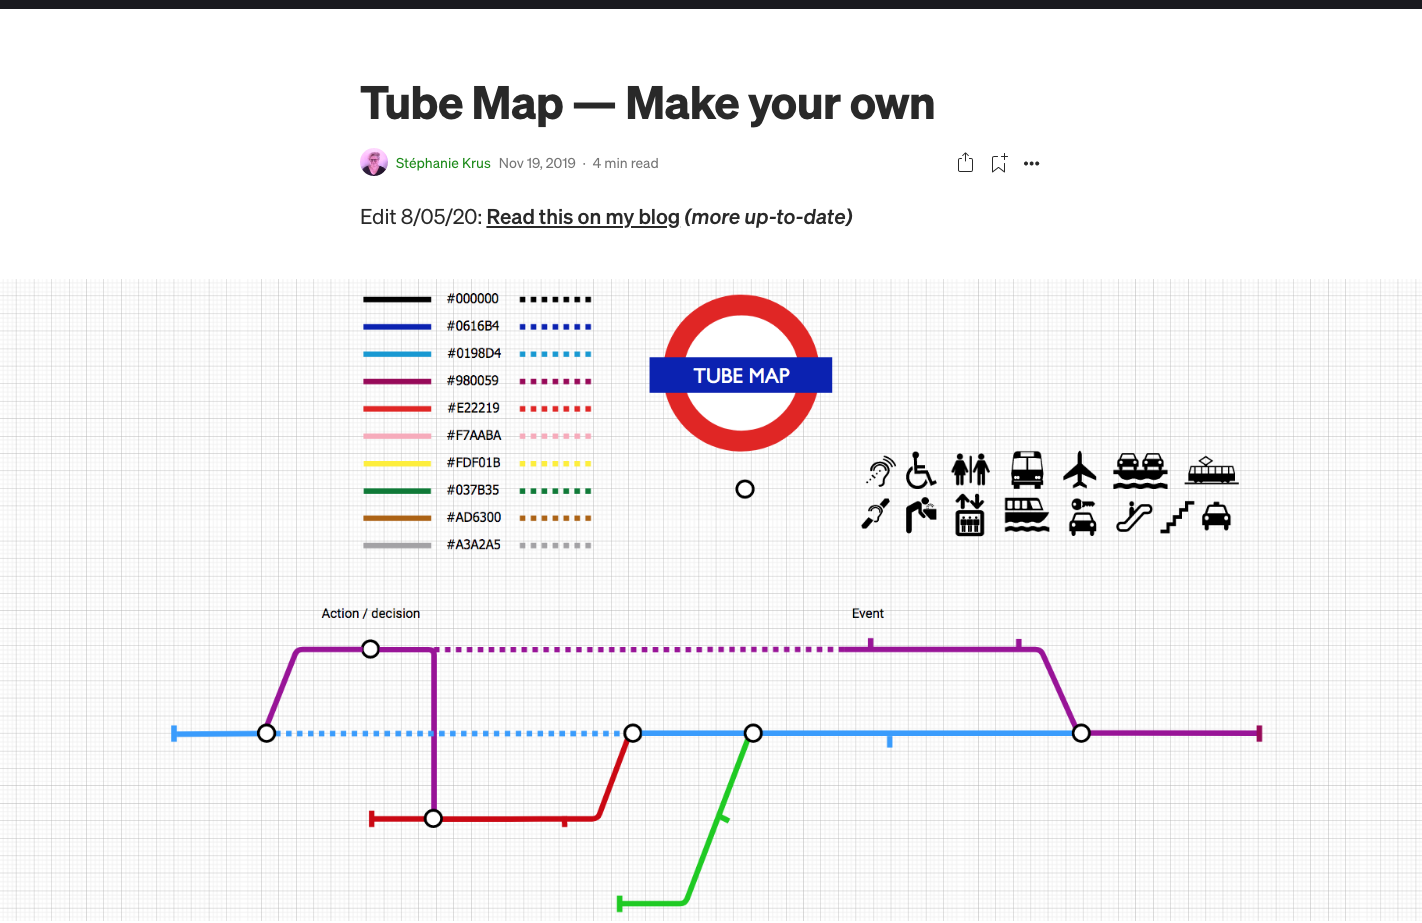
I’ll start with this, because I’m still really puzzled by the amount of people who are checking it. It’s a tutorial to create a tube map from November 2019 initially posted on Medium. A lot of the traffic to my blog actually come from that Medium post. When I left Medium, I added a link to my blog at the top of each post, so even if people have reached the limit of articles they can read in a month on Medium, they can continue reading on my blog.
This blog post is the most read on my blog and it is still getting about 200 views a week on Medium.
And if you search for it via a search engine, it will probably be quite high up on the first page depending on what you type.
If I type “Make tube map” in an incognito window using Google, the Medium post is at the top and the blog post about it is the 5th result on the page. Not sure why but I guess people like tube maps and there are not many other tutorials out there?
This is also the main source of people contacting me to thanks me and tell me they made their own tube map, which is always really nice for me.
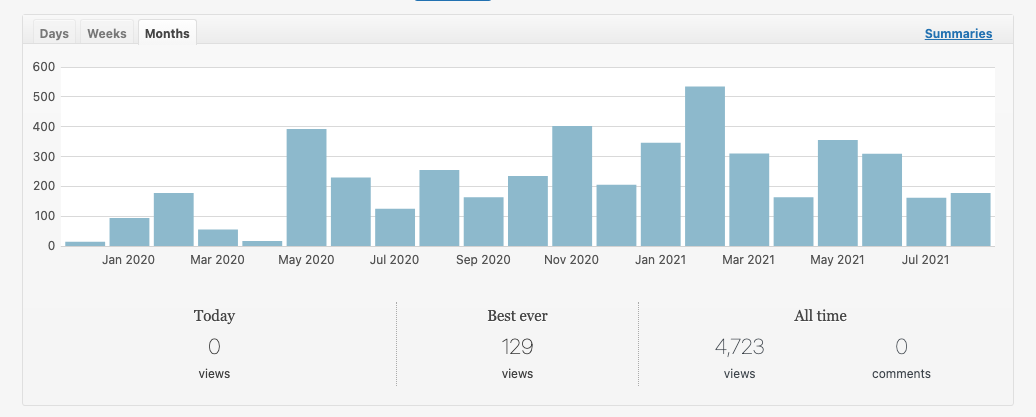
How many readers?
I don’t get a lot of traffic and I’m not trying to get more to be honest. I usually post once on Twitter (and LinkedIn if relevant) when a post is published. Later I share the link of a post when someone ask me for advice for example.
The numbers are irregular and really depend when I post something and if it gets shared by others. I think the biggest numbers of views a day (129 views in one day according to my stats) was when one of my 3 posts about the EU Settlement status was posted as a link in a forum on Reddit.
After the tube map post, the articles on the EU Settlement status are the reason why people contact me, as it looks like it did help quite a few applicants to understand how to apply and what happens next.
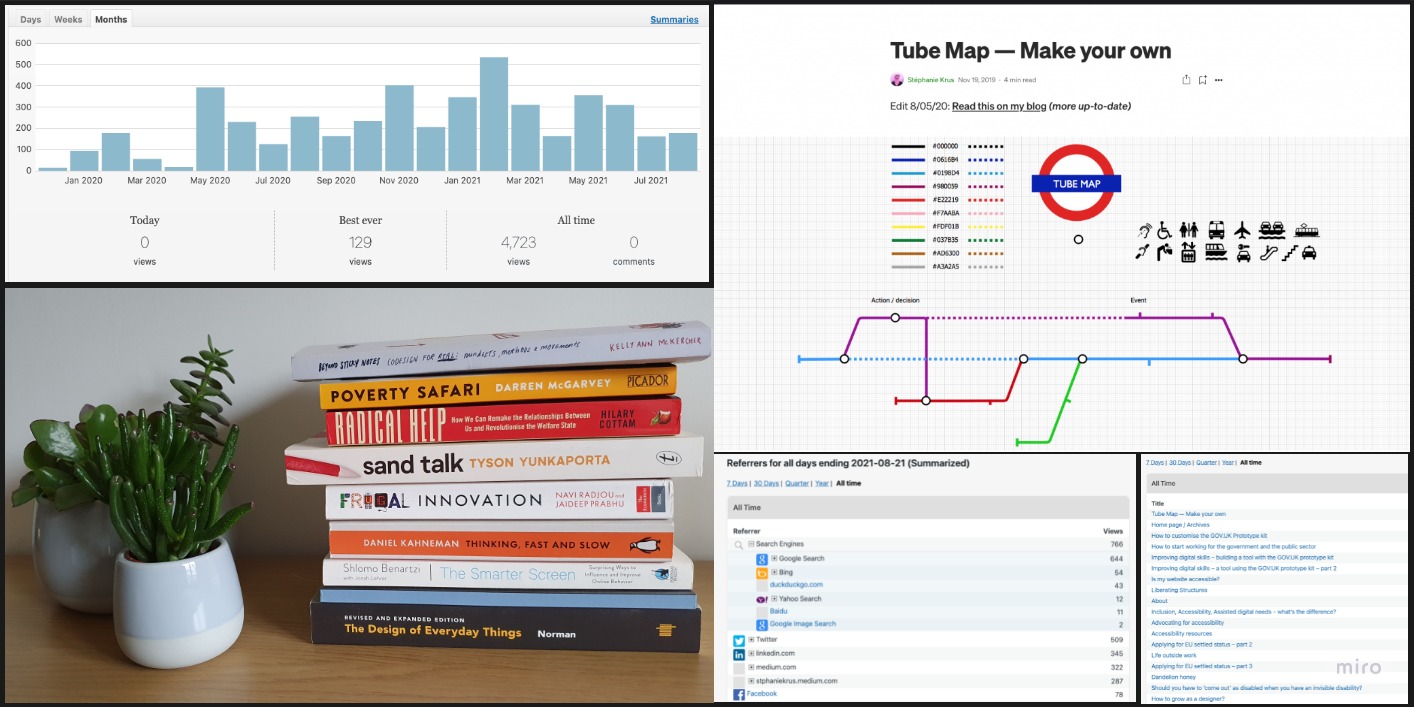
I have Jetpack as a plugin which gives me a bit of stats on my blog. For this blog post, I’m looking at the numbers since I started the blog 18 months ago.
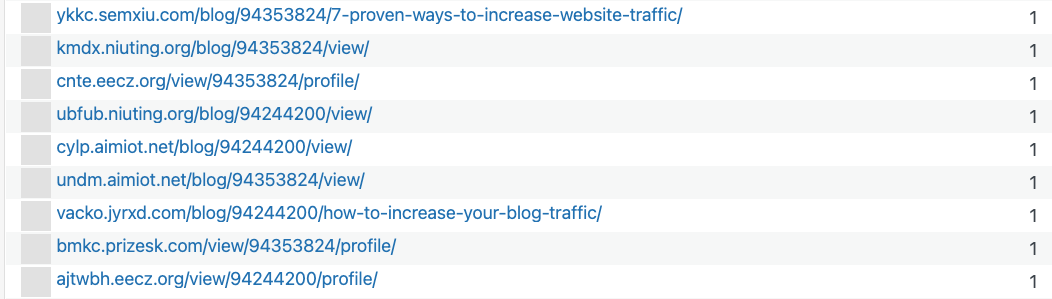
The number of views is higher than the reality. There are a lot of views by bots who are trying to get you to buy services to increase your traffic. You can see that in your referrers list:
How people reach this blog?
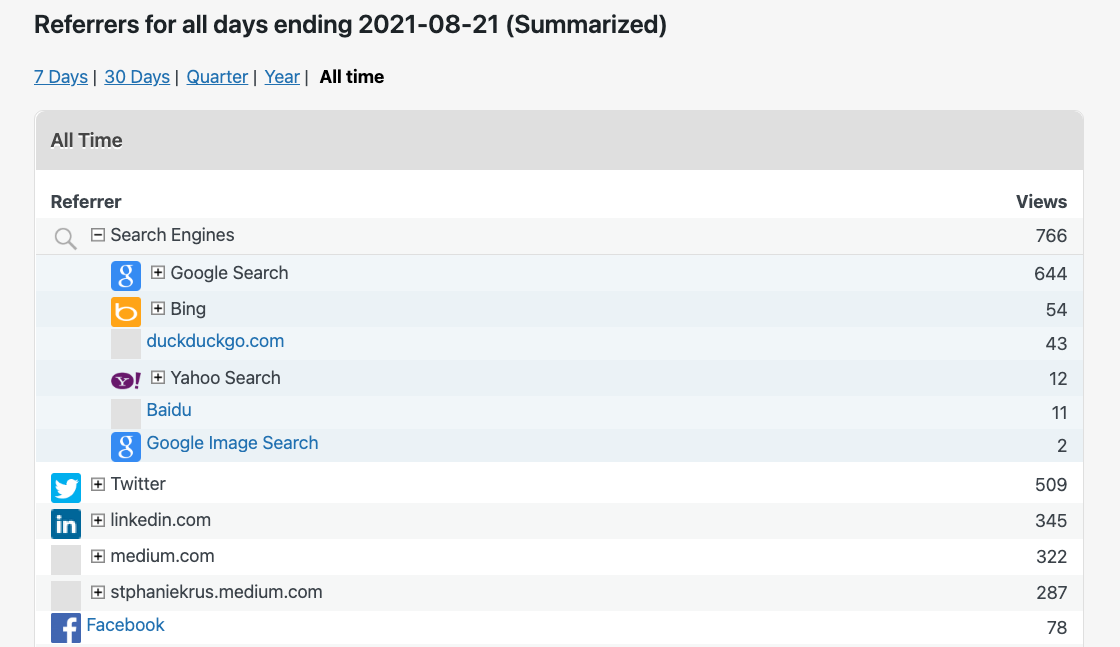
According to these stats, people mostly find the blog via search engines (mostly Google – no surprise here), then Twitter, LinkedIn then Medium and Facebook is far behind (I’m not on Facebook so this makes sense).
I’m not sure why I get so many hits via search engines, it might be because of the tube map post (?). Twitter and LinkedIn are where I share a link when the posts are published and this is where they are most likely to be shared.
Medium is still a big source of traffic, in fact it appears twice in the list and if you add the two, it should be the second biggest source. I think the Tube map post is the main reason for this.
What people read
To be precise I should say what do people view. A view doesn’t mean people are reading the post. The stats on Medium show both numbers (view vs read) and this is often way less. So let’s be realistic here: the real number of readers is probably more like the number of views divided by 2 or 3 if not even less.

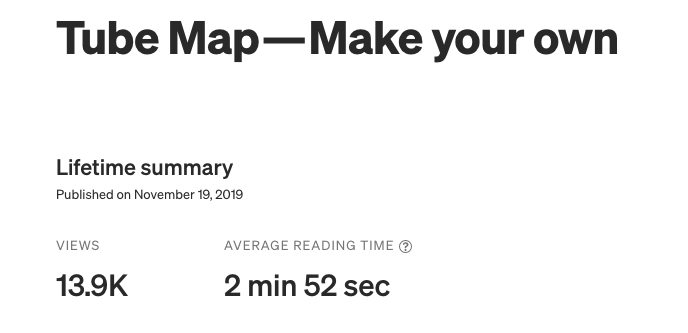
The tube map is at the top with a bit more than 1000 views (way less than on Medium where it’s 13.9K views), then the homepage and then it’s mostly tutorials around the GOVUK prototype kit, or around accessibility.
Time to read a post and when to post
You are more likely to be read if you announce a short ‘reading time’. The tube map is a 4 minutes read. But …. a lot of the other tutorials are quite long posts, like 10 minutes or more. They still get viewed a lot and read as far as I know because I also get contacts about these so I know people do read it and it’s useful to them.
Ideally, yes, short posts are better but you can still write long ones.
I think I remember reading that publishing on weekends, or Monday or Fridays was not ideal (sorry don’t have a source for this). People are less likely to see them or to take action. Tuesdays and Thursdays were the best days for some reason.
I usually just post when it’s ready. I have more time on weekend so yeah…not really boosting my posts 😉
People might like and share without even viewing your post
This happens a lot. I share a link to a new post and get a few likes or it gets shared sometime even with a nice comment. And when I check the number of views at that point in time, it doesn’t add up. There are less views than likes. The Practitioner Stories posts on Medium are very typical of this. More than my own blog. I think people like the idea of it, and ‘trust’ it will be good and share before they even read it (if they even do get to read it later). So it’s one thing to be aware of.
Recipes and write ups
The recipes category is a bit like an alien on this blog, but it serves its purpose: having a place for me to store these and be ready to share when asked. People who asked, read it or not, but this is my mission done.
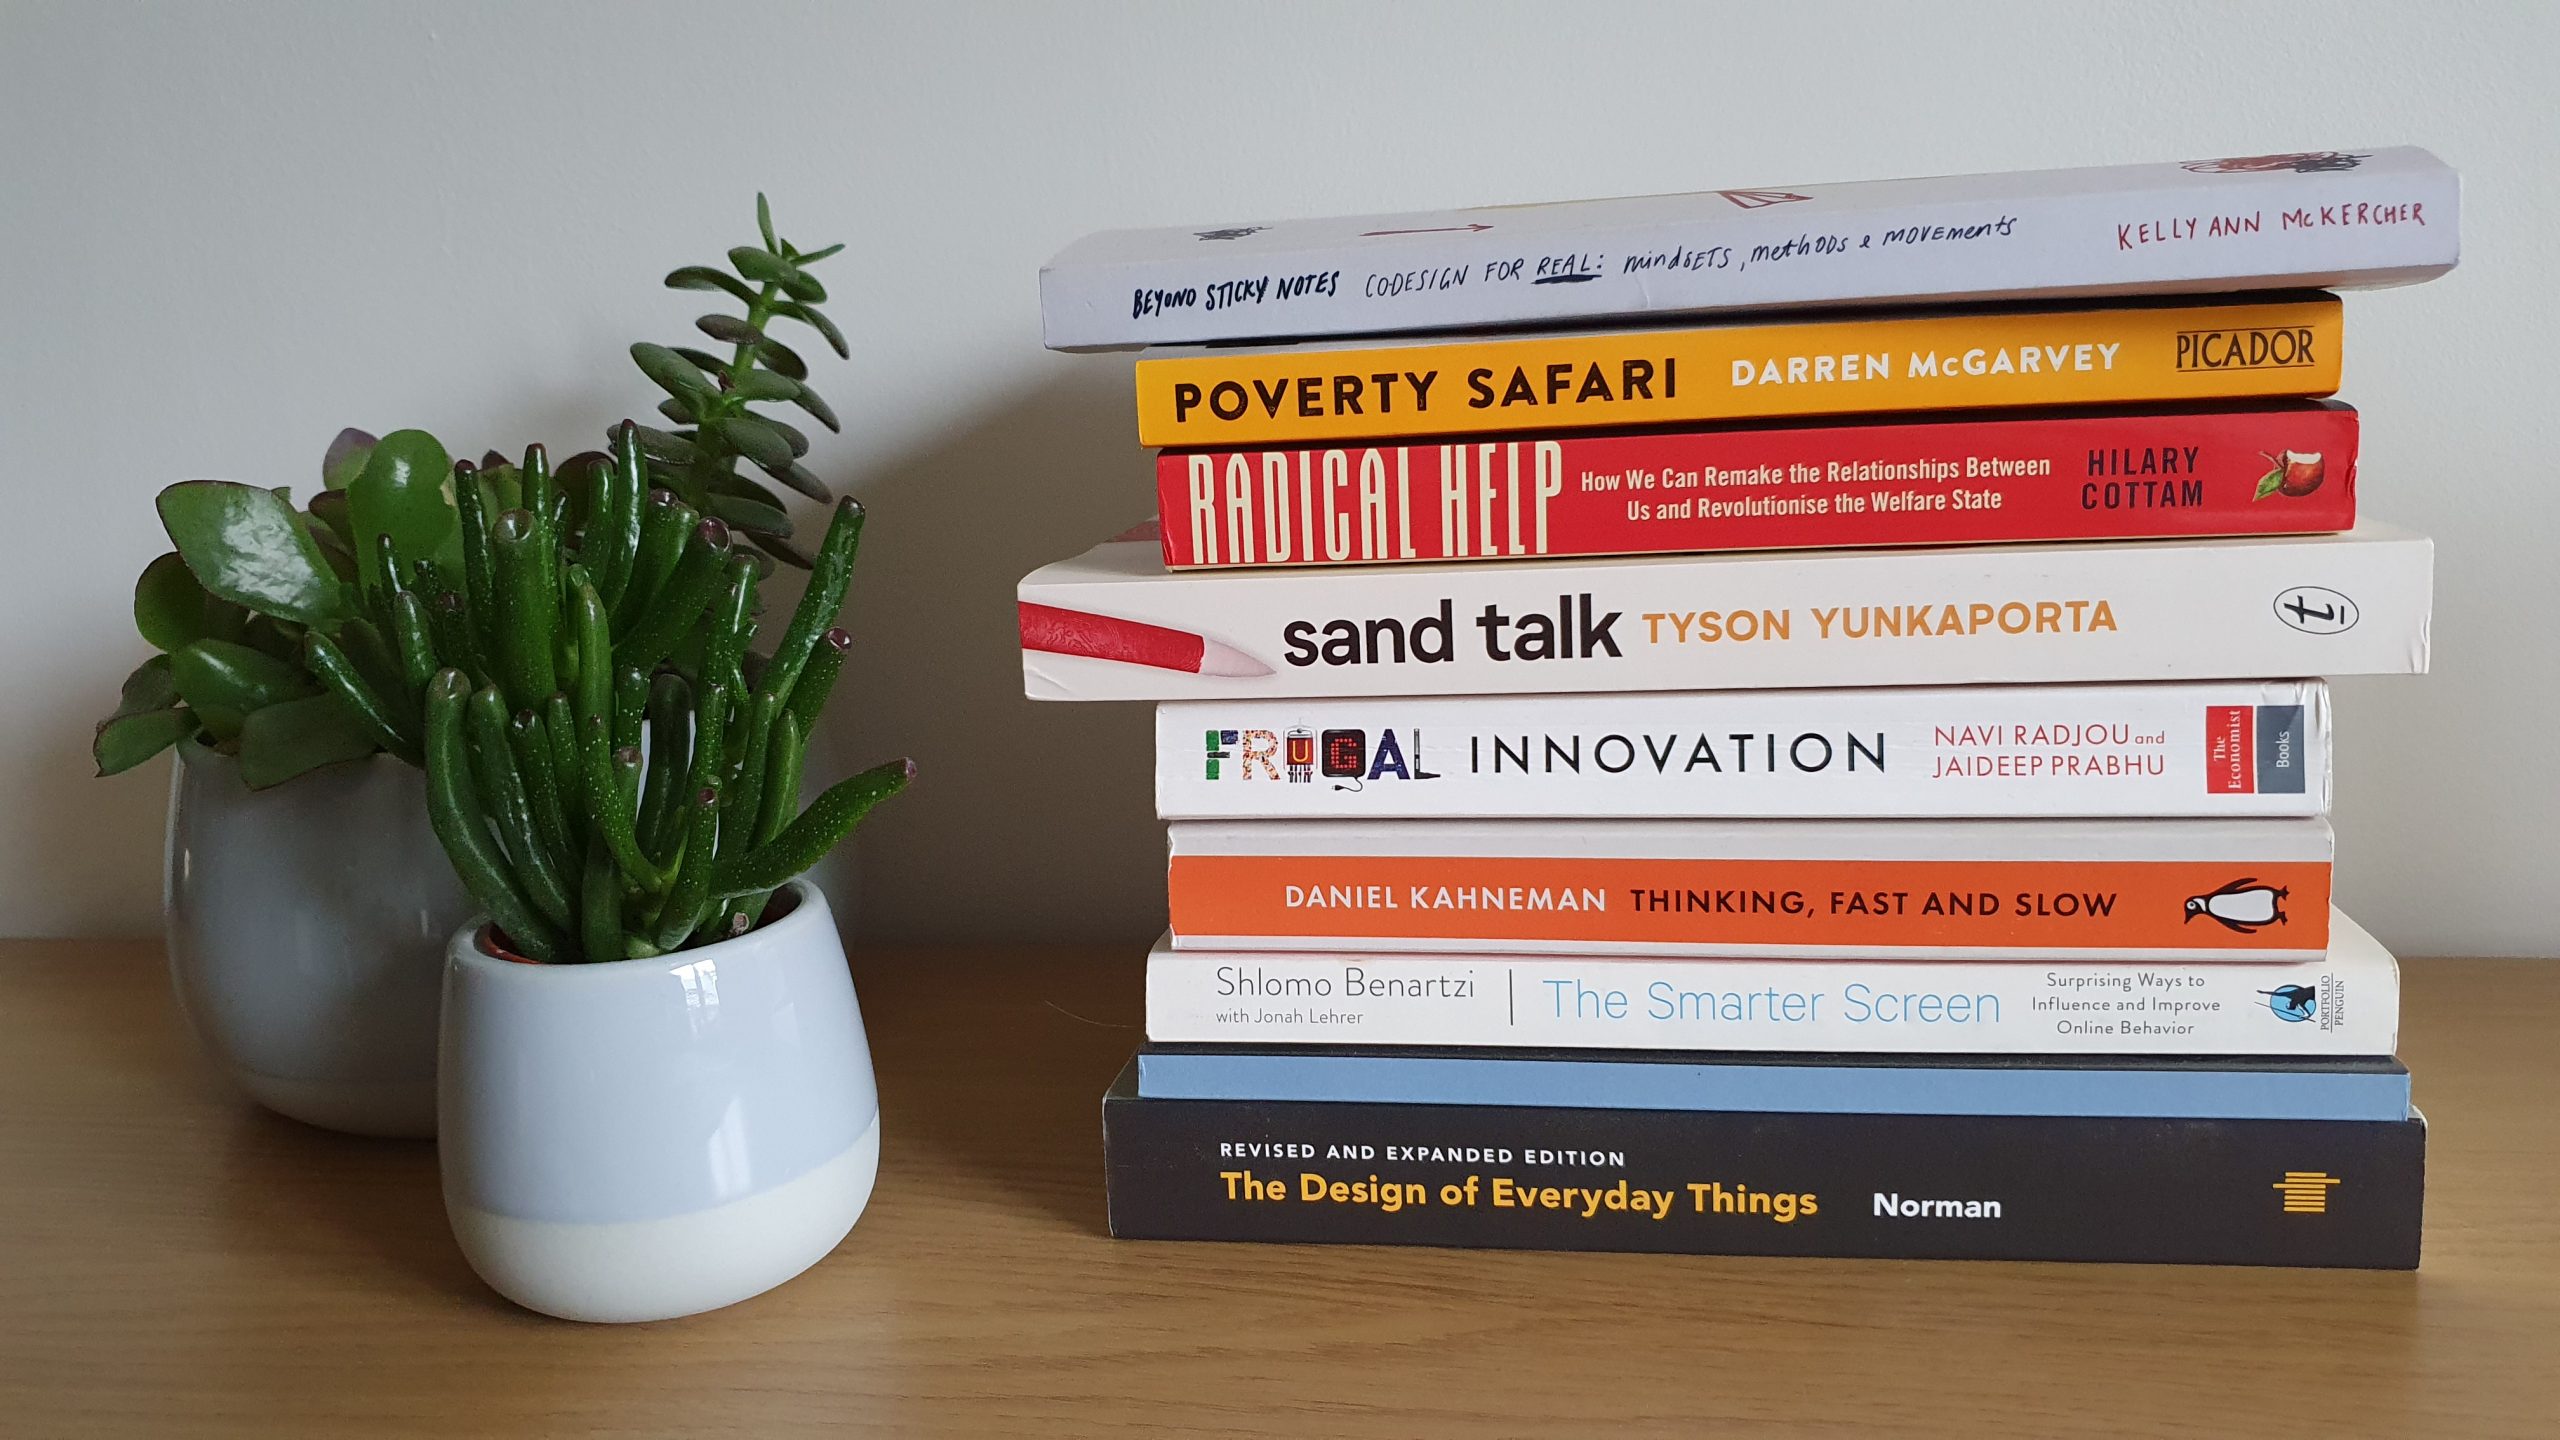
Write ups…..I was planning to do lots of write ups of books I read, conferences or events I attend but honestly I don’t have the time to do it because I attend too many of these. I still have pretty much the same pile of books to read since last year. I made a start on 2 of them, and I read a lot of articles online. But sitting and just reading a book is something I don’t do anymore. Whether for work, studying or leisure. In my mind, I want to get back to it. I think I will. If so, I will gather the notes like I did for Lou Downe’s book: Good Services.
Contacts
Quite a few people get in touch with me. Either publicly on Twitter, or via email or direct messages. It’s always really nice to see that what I wrote was useful to them. Some contacts about the tutorials were people super happy to have managed to customise a prototype or create their own tube map. I know that a few people who were helping others get their EU Settlement status found the 3 posts super useful to understand what was expected, which makes me really happy.
So do get in touch if one of my posts has been helpful. And not just my own posts. Do get in touch with the people who make talks, videos, blog posts or else, I do it quite often and they are usually happy about it.
What next
There are a few conferences I’m going to, so I will probably do write ups for them. I might even read some of the books on my pile. Who knows!
Not going back to Medium, unless there is something I really want to share wider as Medium with all its flaws, is definitely a better solution than your own blog if you want to reach a lot of readers.