Last time I wrote about the blog itself was in August 2021. For anyone curious, here is a peek behind the scenes.
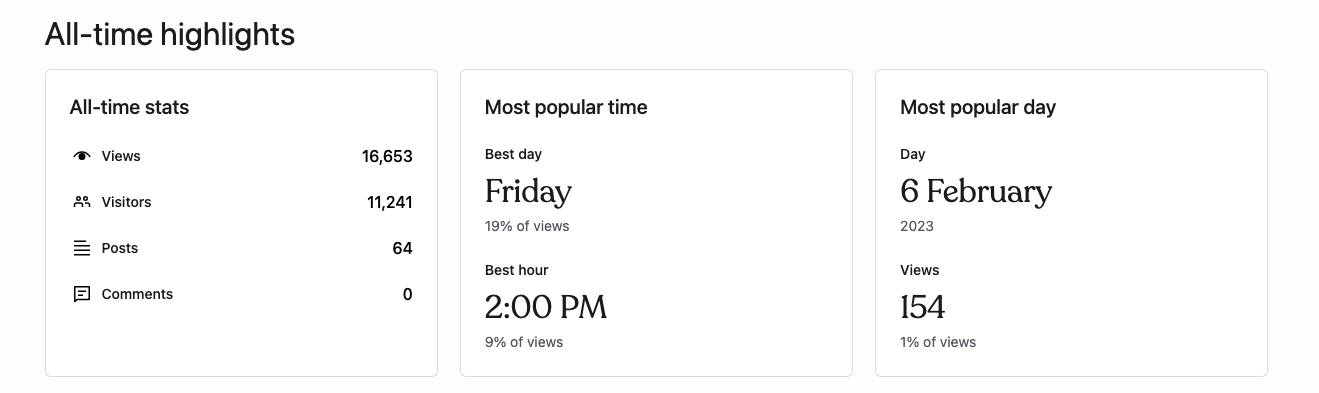
As explained before in “How this blog is doing“, I have Jetpack, a plugin on WordPress which provides me with some stats for free. Some are useful, some not so much. Like the ‘All-time Highlights’ telling me that my best hour is 2pm and my best day is Friday. Not sure what I’m supposed to do with this. I have 0 comment which is not a big surprise as I disabled them 😉
Number of readers
People often assume I have a lot of readers. It depends on what you mean by ‘a lot’.
I don’t know how many people actually read my blog posts. I have stats about ‘views’ which is not the same as people actually reading. On Medium, I had both stats and quite often, the number of ‘reads’ was half or even a third of the ‘views’.
You know yourself: you sometime land on a page (= 1 view) and immediately think: “nah, I’m not reading this!” or read a bit and realise it’s too long or not what you thought you were going to read. So not all viewers become readers.
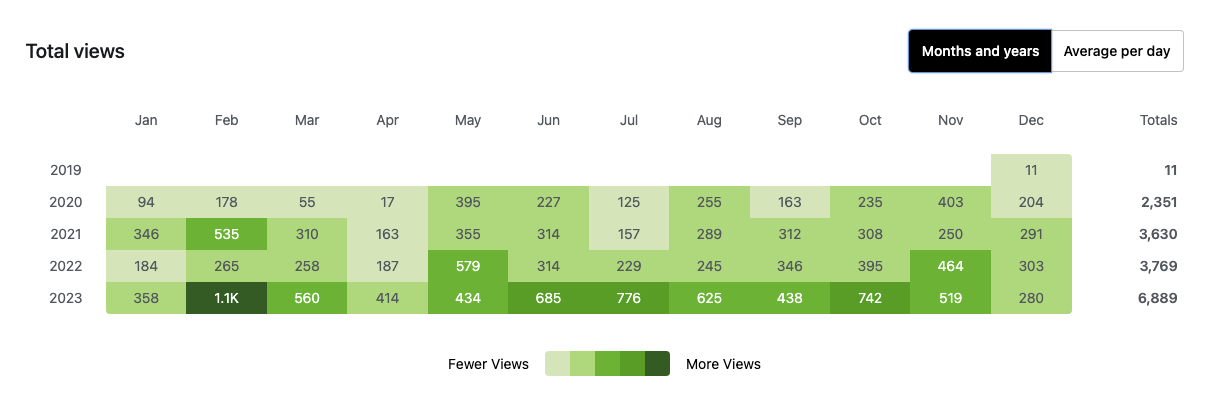
I had more views this year than the previous years, with a peak in February, where I posted 3 times: two posts to gather resources (about power and facilitation) and one where I was reflecting on changing job again …. My posting is very irregular. This will be the 11th post this year.
How people reach my blog
I gave up on subscribing tools because they were either unnecessarily complex or were adding tracking which I didn’t want. Instead, I ‘manually’ maintain the list of people who gets notified when I write a new post. I have 8 people on that list, that’s all.
Everyone else could be aware of the post when I mention it on LinkedIn, usually just once. I’m not on Twitter anymore, and left Facebook long ago. I don’t post about my blog on Mastodon and I’m not really enjoying Bluesky that much so don’t post much there either. People might also subscribe to the RSS feed.
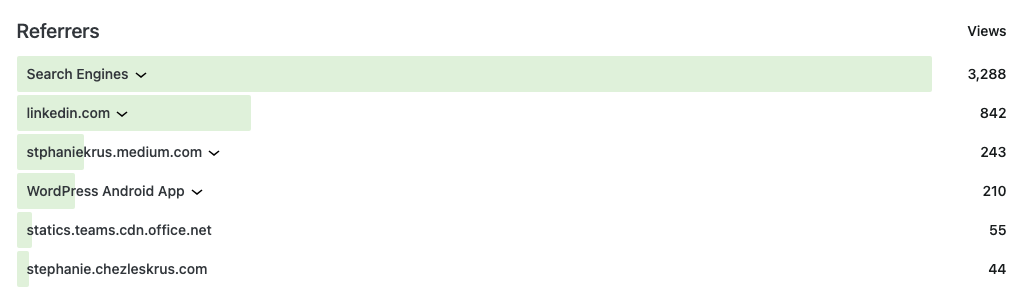
People mostly found my blog via search engine (3000+) and LinkedIn. A small number found me from my portfolio website (44). The rest are mentions of a post on other websites for example.
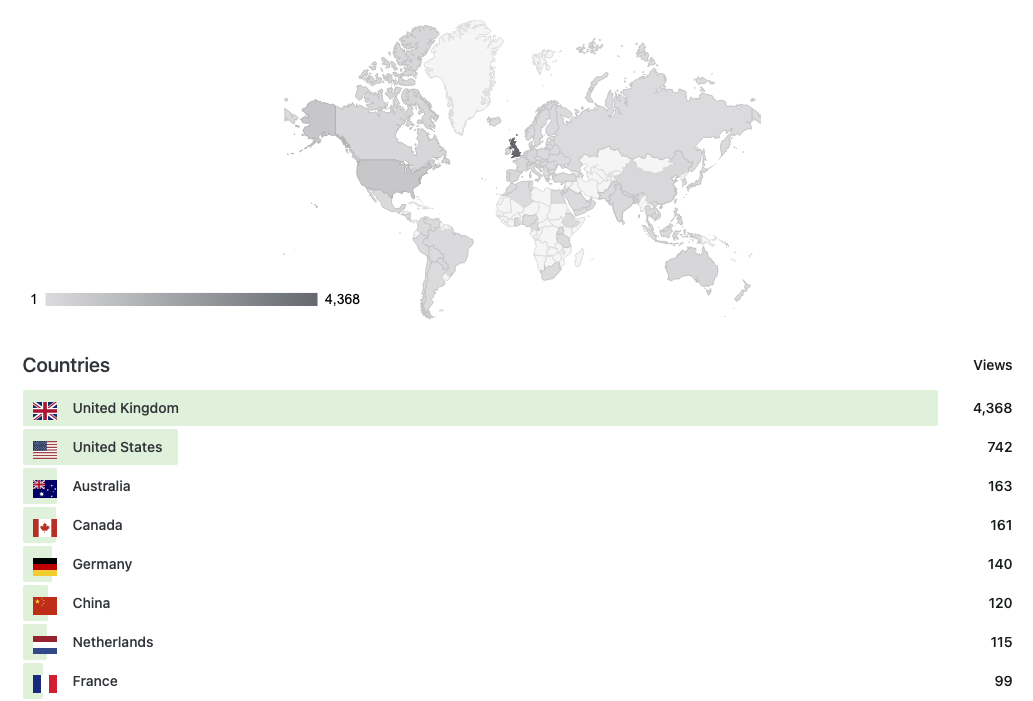
Where are the people accessing my blog
In 2023, like the previous years, most people accessing my blog were in the UK, not surprising. Many are in the US and after that, there are many other countries all over the world. Again, it doesn’t mean people are reading my blog. It’s just that at some point, this year, people in this country reached the website, whether they ended up reading or not.
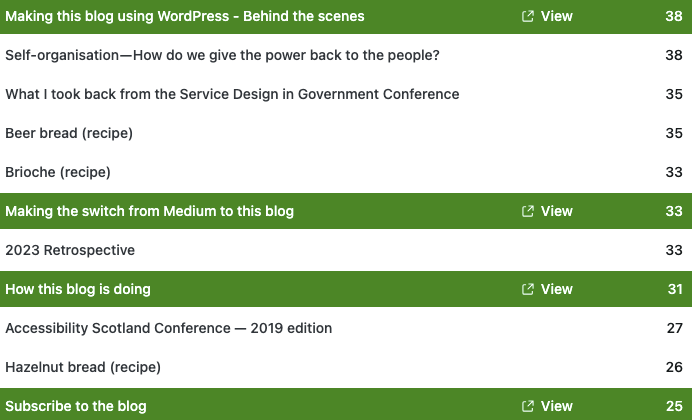
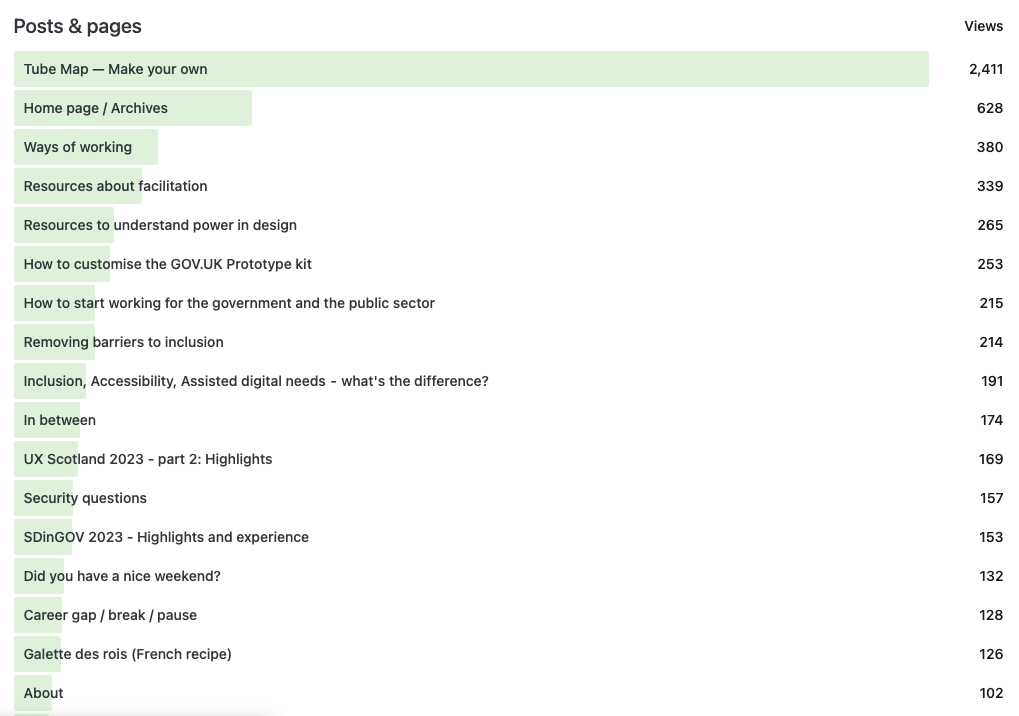
What people read
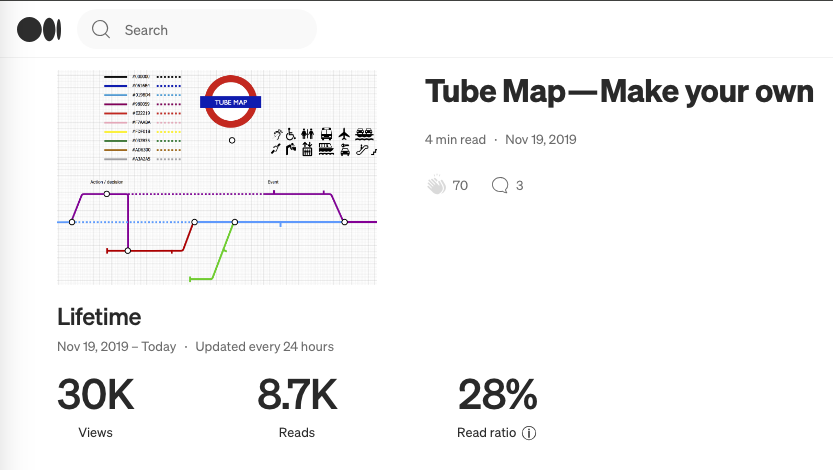
Tube map
The Tube map tutorial post is still way ahead of the rest. As explained last time, I wrote this in November 2019 on Medium and people seemed to really like it. Some contact me to thanks me for it because it helped them creating their own map which is always nice.
I have views nearly every day on the blog, and still have 100 views a week on average on Medium even though I’m not there anymore.
Other things people read
Lots of people visit the homepage, so I assume they find the link to my blog in one of my social media profiles or my portfolio and from there start reading posts…or not.
This year, the blog post “Ways of working” seemed to resonate with people. I got a few contacts about it and then it’s 2 articles of resources, one about facilitation, the other about power in design and a few tutorials.
I wasn’t too sure about adding recipes to this blog, but this seems to work, lots of people are looking at the “Galette des rois” at the moment, which is a bit early 😉 as it’s a French tradition for the Epiphany. The initial intent for this blog was to have a place to share things, which is why it made sense to add the recipes too.
What links people checks
I usually have lots of links in my posts, but people don’t check them that much. Most of the links people do check are about the tutorial explaining how to make a tube map, where I share a template on Github and signpost to draw.io the tool I’m using.
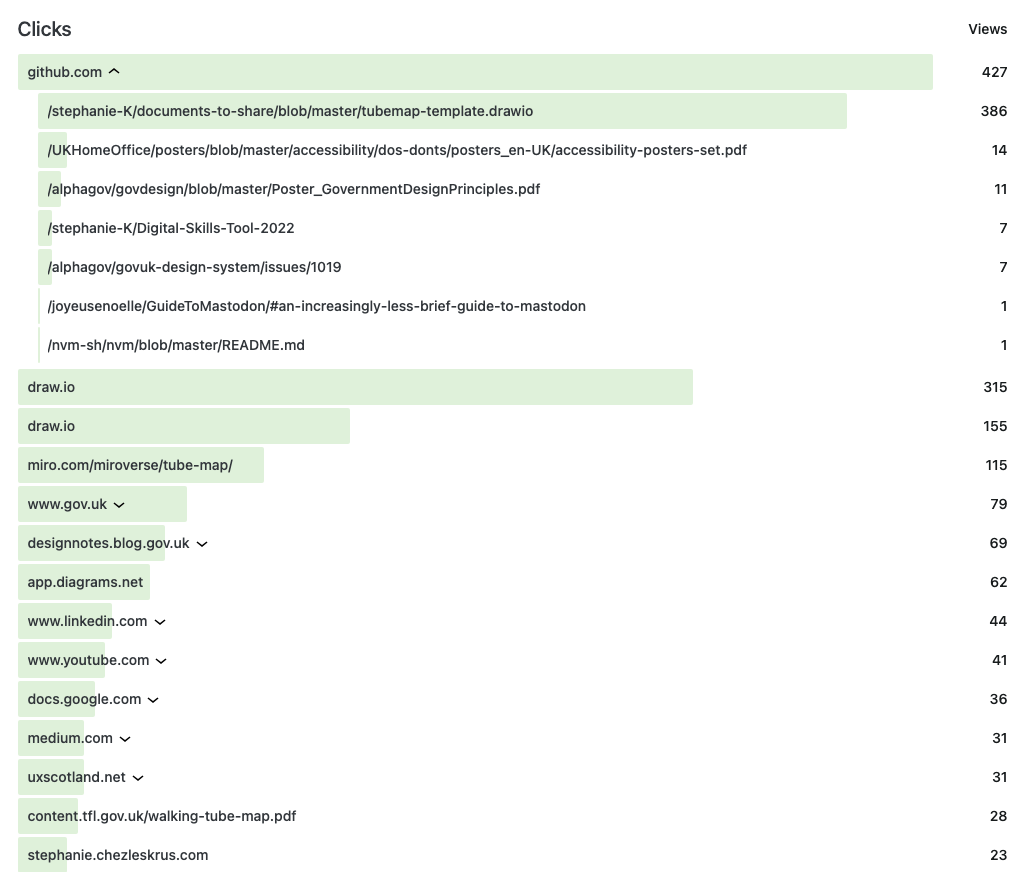
After links about the tube map tutorial, quite a few links go to GOV.UK resources, which makes sense as this is often what I share in my posts as sources.
Reviewing the categories
I had a “Write-up” and a “Book notes” categories but I’ve merged them into “Summaries”, because I don’t read so many books and when I do, working on the summaries feels like a chore. So apart from the one for “Good Services” I never did further summaries here. I keep my own notes for books which make sense to me but there is probably little value for me to write them up and share these wider.
Blog category
If you are still reading, well done! you are among the very few who seem interested in this category ahahahah! the 4 blog posts about the blog itself are among the lowest number of all-time views.